Nexora Radialالمخطط الشعاعيRadial Chart
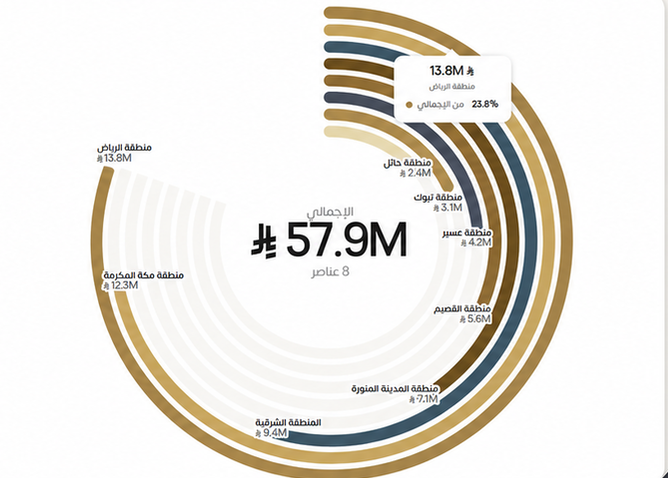
مخطط شعاعي يقارن الفئات في أقواس دائرية واضحة، مع إجمالي أو متوسط في المنتصف وخيارات مرنة للألوان والتسميات.A premium radial bar chart that compares categories in an elegant circular layout with an average at its core.
- سماكة الأقواس وتباعدها وزواياها قابلة للتعديلRadial arcs with adjustable thickness, spacing and angles
- هالة حول التسميات لضمان وضوحهاArc labels with an adjustable halo (colour/width)
- لون واحد أو تدرج أو حتى ثمانية ألوان أو ألوان الثيمColour modes: single / gradient / multi (up to 8) / from theme
ما الذي تضيفه الأداة؟The problem it solves
لماذا المخطط الشعاعي؟Why Radial Chart?
عندما تريد مقارنة عدد محدود من الفئات في مساحة مدمجة، يقدم Nexora Radial بديلًا بصريًا عن الأعمدة التقليدية، ويضع المتوسط أو الإجمالي في المنتصف ليمنح المقارنة سياقًا مباشرًا.Comparing several categories in a plain bar chart can look monotonous and consume space. Nexora Radial shows categories as graded circular arcs with a central scale that summarises the total or average.
متى تناسبك؟When to use it
مقارنة الفئات في مساحة مدمجةComparing categories visually in a compact space
إبراز ترتيب الأعلى والأدنىHighlighting category ranking (highest/lowest)
عرض حصة كل فئة من الإجماليExecutive dashboards needing a striking circular element
إضافة عنصر دائري واضح إلى لوحة تنفيذيةShowing each category’s share of the total
المزايا والإعداداتFeatures & settings
المزايا الرئيسيةKey features
الخصائص التالية متاحة ضمن إعدادات الأداة داخل Power BI.Every feature is taken from the visual’s actual settings.
العرضDisplay
- سماكة الأقواس وتباعدها وزواياها قابلة للتعديلRadial arcs with adjustable thickness, spacing and angles
- إجمالي أو متوسط في المنتصف مع تسمية مخصصةCentral scale (total/average) with a custom label
- مسار خلفي اختياري للأقواسOptional background track for the arcs
- تحكم كامل في العنوان والخطوطFull font control and a title with an accent word
التسمياتLabels & legend
- هالة حول التسميات لضمان وضوحهاArc labels with an adjustable halo (colour/width)
- مفتاح Power BI يدعم العربية ومواضع متعددةOfficial Power BI legend with Arabic support and multiple positions
- تخطيط قابل للتعديل للتسمياتAdjustable label layout
- تنسيق القيم على الأقواسValue formatting on the arcs
الألوانColours
- لون واحد أو تدرج أو حتى ثمانية ألوان أو ألوان الثيمColour modes: single / gradient / multi (up to 8) / from theme
- تدرج بين حد أدنى وأعلىGradient between a min and a max colour
- دعم النسب والعملات والريالPercent / currency formatting with the Riyal
- ألوان مستقلة للتسمية والقيمةIndependent label and value text colours
خطوة بخطوةStep by step
طريقة الإعدادHow to use
أضف الأداة إلى الصفحةImport the visual and add it to the page
ضع التصنيف في Category والمقياس في ValuePut the category in Category and the measure in Value
اختر نمط الألوانChoose the colour mode (gradient/multi/from theme)
فعّل المقياس المركزي وحدد ما يعرضهEnable the central average and choose what it shows
اضبط المفتاح والتسميات والهالةAdjust the legend, labels and halo
نسّق الأرقام ثم انشرSet the number format, then publish
مثال تطبيقيA practical example
سيناريو: مقارنة الفئات في مساحة مدمجة.Scenario: Comparing categories visually in a compact space.
اربط الحقول المطلوبة (Category، Value) لتحصل على المخطط الشعاعي جاهزة بهوية نيكسورا.Bind the required fields (Category, Value) to get a ready Radial Chart in the Nexora identity. القيم الظاهرة في الأمثلة توضيحية فقط.* Display numbers are illustrative.
الحقولFields
الحقول المطلوبةData requirements
أضف الحقول التالية إلى لوحة الحقول في Power BI.The fields you place in the field well inside Power BI.
| الدور (Field well)Role (Field well) | النوعType | الإلزامRequired | الوظيفةPurpose |
|---|---|---|---|
| Category — التصنيفCategory | تصنيفCategory | مطلوبRequired | الفئات (أقواس)The categories (arcs) |
| Value — القيمةValue | مقياسMeasure | مطلوبRequired | طول كل قوسLength of each arc |
لوحة الحقولField well
استخدام أفضلQuality
نصائح الاستخدام وما يُتجنّبBest practices & common mistakes
نصائح الاستخدامBest practices
- استخدم من 8 إلى 10 فئات كحد مفضلLimit the number of categories (≤ 8–10 preferred) for clarity
- أظهر المتوسط أو الإجمالي في المنتصفUse the central scale to give overall context
- حافظ على وضوح التسميات فوق الألوانMake the halo strong enough to read labels over any colour
- رتب الفئات تنازليًاSort categories descending to highlight ranking
تجنّبAvoid
- ✕ استخدام عدد كبير من الفئاتToo many categories make the arcs unreadable
- ✕ اختيار ألوان متقاربةClose colours that are hard to tell apart
- ✕ إخفاء الهالة فوق خلفية مزدحمةDisabling the halo over a busy background
- ✕ استخدامه لاتجاه زمني طويلUsing it for time-series data (Line is better)
أسئلةQuestions
الأسئلة الشائعةFAQ
كم فئة يناسبه؟How many categories does it support?+
هل يدعم المفتاح العربي؟Does the legend support Arabic?+
هل يمكن تخصيص الألوان؟Can colours be changed?+
جرّب Nexora RadialReady to try Radial Chart?
جرّب الأداة، أو اطلب لوحة Power BI مخصصة باستخدام أدوات نيكسورا.Start your trial or use it inside a custom dashboard.