Nexora Heatmapالخريطة الحراريةHeatmap
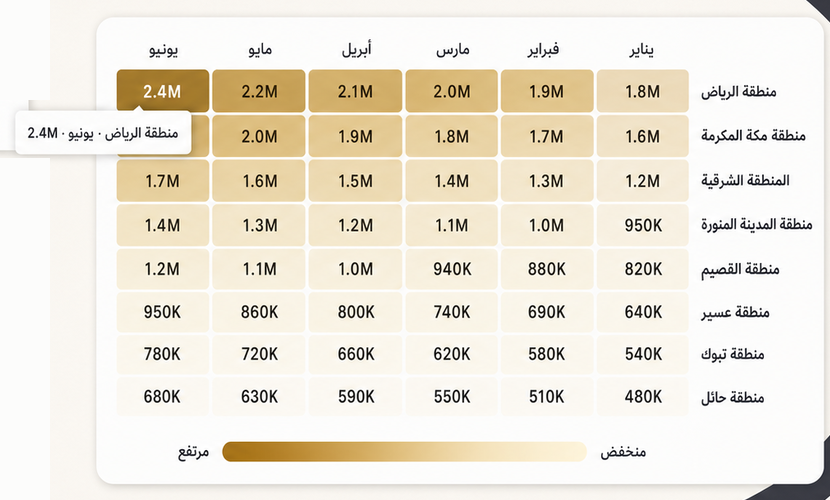
خريطة حرارية تكشف مناطق التركّز والارتفاع والانخفاض عبر بُعدين، باستخدام تدرج لوني واضح وقيم قابلة للعرض داخل الخلايا.A premium matrix heatmap that reveals concentration across two dimensions at a glance with thoughtful colour scales.
- تدرج متسلسل بين حد أدنى وأعلىSequential scale between a min and a max colour
- إظهار القيم داخل الخلاياShow values inside cells with adjustable size
- دعم النسب والعملات والريالPercent / currency formatting with the Riyal
ما الذي تضيفه الأداة؟The problem it solves
لماذا الخريطة الحرارية؟Why Heatmap?
مقارنة بُعدين مثل المنطقة والشهر داخل جدول تجعل النمط صعب القراءة. تحول Nexora Heatmap القيم إلى ألوان، فتظهر القمم والفجوات مباشرة.Spotting patterns across two dimensions (e.g. region × month) is hard in tables. Nexora Heatmap reveals concentration with colour so high and low areas appear instantly.
متى تناسبك؟When to use it
تحليل الكثافة عبر فئتينDensity analysis across two categories
مقارنة الأشهر بالمناطقComparing periods and categories (month × region)
اكتشاف القمم والفجواتSpotting peaks and gaps
قراءة أنماط الأداء داخل شبكةPerformance patterns across a grid
المزايا والإعداداتFeatures & settings
المزايا الرئيسيةKey features
الخصائص التالية متاحة ضمن إعدادات الأداة داخل Power BI.Every feature is taken from the visual’s actual settings.
المقياس اللونيColour scales
- تدرج متسلسل بين حد أدنى وأعلىSequential scale between a min and a max colour
- تسميات لأطراف المقياسEndpoint labels (low/high)
- مفتاح لوني اختياريOptional colour legend
- تحكم في المسافة والحواف بين الخلاياAdjustable cell gap and edges
القيم والتسمياتValues & labels
- إظهار القيم داخل الخلاياShow values inside cells with adjustable size
- إضافة لاحقة للقيمةOptional value suffix
- ألوان مستقلة لعناوين الصفوف والأعمدةIndependent row and column label colours
- تحكم في الخطوطFont control
التنسيقFormatting
- دعم النسب والعملات والريالPercent / currency formatting with the Riyal
- عنوان قابل للتخصيصTitle with an accent word
- خلفية وحدود قابلة للتعديلAdjustable background and edges
- زوايا خلايا قابلة للتخصيصAdjustable cell corners
خطوة بخطوةStep by step
طريقة الإعدادHow to use
أضف الأداة إلى الصفحةImport the visual and add it to the page
ضع البعد الأول في Rows والثاني في Columns والمقياس في ValuePut categories in Rows and Columns and the measure in Value
اختر لوني الحد الأدنى والأعلىChoose the colour scale (min/max colours)
فعّل القيم داخل الخلايا والمفتاح عند الحاجةEnable in-cell values and the legend
اضبط المسافات والزوايا والخطAdjust the gap, corners and font
نسّق الرقم ثم انشرSet the number format, then publish
مثال تطبيقيA practical example
سيناريو: تحليل الكثافة عبر فئتين.Scenario: Density analysis across two categories.
اربط الحقول المطلوبة (Rows، Columns، Value) لتحصل على الخريطة الحرارية جاهزة بهوية نيكسورا.Bind the required fields (Rows, Columns, Value) to get a ready Heatmap in the Nexora identity. القيم الظاهرة في الأمثلة توضيحية فقط.* Display numbers are illustrative.
الحقولFields
الحقول المطلوبةData requirements
أضف الحقول التالية إلى لوحة الحقول في Power BI.The fields you place in the field well inside Power BI.
| الدور (Field well)Role (Field well) | النوعType | الإلزامRequired | الوظيفةPurpose |
|---|---|---|---|
| Rows — الصفوفRows | تصنيفCategory | مطلوبRequired | البُعد الأولFirst dimension |
| Columns — الأعمدةColumns | تصنيفCategory | مطلوبRequired | البُعد الثانيSecond dimension |
| Value — القيمةValue | مقياسMeasure | مطلوبRequired | القيمة التي تحدد شدة اللونColour intensity |
لوحة الحقولField well
استخدام أفضلQuality
نصائح الاستخدام وما يُتجنّبBest practices & common mistakes
نصائح الاستخدامBest practices
- استخدم فرقًا واضحًا بين لوني البداية والنهايةUse enough colour contrast between the two ends
- حافظ على عدد مقروء من الصفوف والأعمدةKeep the number of rows/columns readable
- أظهر القيم إذا كان الرقم مهمًا بجانب النمطEnable values when the number matters, not just the pattern
- استخدم مقياسًا واحدًا واضحًاChoose one clear measure for intensity
تجنّبAvoid
- ✕ اختيار ألوان متقاربةClose colours hide the differences
- ✕ إنشاء شبكة ضخمة بخلايا صغيرةA huge grid with tiny cells is unreadable
- ✕ إخفاء المفتاح عندما لا تكون دلالة اللون واضحةHiding the legend makes colours hard to interpret
- ✕ جمع فئات غير متجانسة داخل بعد واحدMixing heterogeneous categories in one dimension
أسئلةQuestions
الأسئلة الشائعةFAQ
ما الحقول المطلوبة؟What fields are required?+
هل يمكن تغيير المقياس اللوني؟Does it support multiple colour scales?+
هل تدعم العربية؟Does it support Arabic?+
جرّب Nexora HeatmapReady to try Heatmap?
جرّب الأداة، أو اطلب لوحة Power BI مخصصة باستخدام أدوات نيكسورا.Start your trial or use it inside a custom dashboard.